Abstract
Ozone and temperature are the primary elements to influence hospital admissions for asthma. However, the field studies shows that the correlation among these variables is still unclear. In the light of the uncertainty and the consideration to the relative effectiveness of the study area, this paper focuses on California's South Coast Air Basin area where entails much ozone depletion to analyze their relationships, and to examine the reaction time of ozone and temperature to asthma. Poisson Model and Xtpoisson Model are applied due to the panel data set and the dependent variable, which is the hospital admissions for asthma, with non-negative integer values. In addition, geographic information system (GIS) methodology is used to refrain from the spatial barrier and to advance the estimates of ozone exposure to individuals.
Introduction
The purpose of this paper is to find out how ozone and temperature associate with hospital admissions for asthma in California's South Coast Air Basin area during a three-year period from 1997 to 1999. The explanatory variables categorize into two parts - environmental and social-effect aspects. Ozone and temperature pertain to environmental variables, whereas social-effect variables include age, race, sex, income, and educational level. The hospital admissions for asthma are considered the dependent variable; Poisson Model is applied as a result of the dependent variable with non-negative integer values. Furthermore, Xtpoisson Model is used in the software of Stata because of the panel data set, which includes both cross-sectional and time-series information. Geographic information system (GIS) methodology is used as well to avoid the spatial obstruction and to advance the estimates of ozone exposure to individuals.
According to an estimate, “the prevalence of asthma has increased approximately 50 percent over the last 10 to 15 years on a global basis” (Ritchie & Lehnen, 2004). The prevalence of asthma can be as high as 30 percent among certain populations. In the United States between 1990 and 1994, the number of people reported to suffer from asthma increased from 10.4 million to 14.6 million. There are over 5,000 deaths annually due to asthma (National Institutes of Health [NIH], 1998). In addition, a study sponsored by the Asthma and Allergy Foundation of America indicates that the costs of asthma care increased 54 percent over the 1985-1994 time periods (Sachs,2001). The indirect costs (workdays lost, time lost from school, and costs attributed to asthma deaths) during this period increased 133 percent, and direct medical costs (hospitalizations, doctors' visits, and medications) rose from $5 billion to just over $6 billion. Expenditures for asthma medications rose 30 percent, and the total number of prescriptions rose by 103 percent (Sachs,2001).
Potential triggers of asthma include infections, diet, and exposure to indoor allergens or outdoor pollutants (NIH, No date). The results of serial prevalence studies have shown that asthma is becoming more common while there has been a concomitant increase in concern about air pollution (Ritchie et al., 2004; Thompson et al., 2001). Specific causes of asthma, however, are still unclear. Ozone, as one of the risky factors, remains debatable. There is not enough evidence to discern the role of temperature in relation to asthma either. In addition, according to aforementioned data, asthma not only ranks among the most common chronic conditions in the United States but also results in extensive utilization of health care. Thus, the related research on the relationships among asthma, ozone, and temperature is indispensable in order to diminish hospital admissions for asthma and control the costs of health care.
On the other hand, the environment is harmed by the by-products of economic activity accompanying a negative externality. Government policies and regulations are needed to improve this damaged environment (Brux, 2005, p. 57-58; 62-63). Most people are concerned to some degree about environmental issues. In response to the environmental damage, as well as the consideration to relative effectiveness of the study area, this paper focuses on California's South Coast Air Basin area, as a result of where it is flooded with severely photochemical smog a cloud of toxic chemicals comprising ozone and a variety of caustic agents.
Literature Review
Tracking the path of the research over the years on causes of asthma, there are still many discrepancies and obscurity. However, field studies have produced evidence that asthma is a clinical condition characterized by intermittent respiratory symptoms, and airway inflammation as a paramount feature of the pathogenesis of asthma (American Thoracic Society, 1996; Balmes, 1993). Human exposure and epidemiological studies report that exposure to stimulants (ozone, carbon monoxide, smoke, perfume, particulate matter, etc.) and irritable originals (dust, pollen, mould, etc.) are mainly associated with an increased rate of asthma attacks. In addition, some studies demonstrate the roles that meteorological effects (temperature, humidity, wind speed, and dew point) and medication use individually or in combination, play in the causation and exacerbation of asthma (Balmes, 1993; Browne, Ju, Recer, Kallenbach, Melius, & Horn, 2001; Ritchie et al., 2004).
Some field studies support that ozone appears to be a key pollutant of asthma, but epidemiological studies suggest that the association between asthma and ozone exposure is limited (American Thoracic Society, 1996; Buchdahl, Parker, Stebbings, & Babiker, 1996; Schoettlin & Landau, 1961). During summer, there are higher peripheral ozone concentrations, so that in studies the quality of outdoor air is commonly blamed for a host of harmful effects on asthma. On the contrary, some studies show that ozone exposure is very high during the summer months but is not associated with an increased rate of asthma attacks (Balmes, 1993; Ritchie et al., 2004). According to a survey, “the highest rates of asthma attacks requiring hospital visits occur during the spring and fall pollen seasons” (Pediatric Health News Releases, 2003). By synthesizing the various studies it appears that it is still unknown whether persons with asthma are more susceptible to ozone. The findings of these studies are contradictory to the conjunction between hospital visits for asthma and ozone concentrations.
The meteorological variables which are temperature, humidity, wind speed, and dew point emerge as an additional important trigger of asthma attacks. Among the variables, temperature transition is considered the dominant predictor related to hospital admissions for asthma. Nevertheless, the findings for temperature are still difficult to discern its role in asthma attacks. Some studies report that a positive association exists between hospital admissions for asthma and temperature (Balmes, 1993; Tolbert, Mulholl, MacIntosh, Xu, Daniels, Devine, Carlin, Klein, Dorley, Butler, Nordenberg, Frumkin, Ryan, & White, 2000). However, some statistical analyses demonstrate that they have a negative association (Buchdahl, et al., 1996; Ritchie et al, 2004). In addition, there are some studies arguing that no association is noted between temperature and hospital admissions for asthma (Thompson, Shields, & Patterson, 2001).
In the light of uncertain effect of ozone and temperature upon asthma in the field studies, this paper will analyze their relationships and examine the reaction time of ozone and temperature to asthma.
Study Area and Social Characteristics
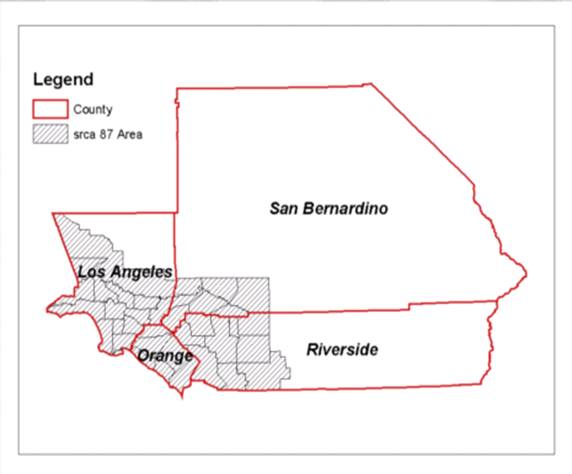
Figure 1 shows that the study area encompasses California's South Coast Air Basin area,including Orange, part of Los Angeles, Riverside, and San Bernardino Counties. The study area is regarded as heavily populated region together with fleetly increasing road vehicles and industrial plants, resulting from growing economic development and industrialization. With relation to these pollutants, certain chemicals, primarily chlorofluorocarbons and carbon monoxide are released by car exhausts, and industrial wastes damage the ozone layer of the atmosphere. As a result, the study area entails much ozone depletion.
Figure 1
Study Area - California’s South Coast Air Basin area
The study population includes all people who were admitted to a hospital and having zip codes in the study area during the period of 1997 through 1999. Between the periods of study, the percentage of population change in the study area is 4.5, and the population in 1999 is around nine million. About the age of the population, the ratio of persons under 5 years old to total population is 7.3 percent. The percentage with regard to persons under 18 years old as well as 65 years old and over is 27.3 and 10.6, separately. The rate of both sexes can be divided into halves. In addition, over half of the population includes white people, Asian people occupy 10.9 percent, and black or African American people are 6.7 percent. The percentage of other races is below 5 (U.S. Census Bureau, 2005).
On average, per capita money income in the study area is 22,711 dollars. The median household income is 47,493 dollars. There is up to 14.2 percent of people, however, whose income is below poverty line. Additionally, people, age over 25, as well as having gotten Bachelor's degree or higher is 26.6 percent. The percentage of people with high school degrees is 50 percent higher than those with Bachelor’s degrees (U.S. Census Bureau, 2005).
Air Quality Aspects
The South Coast Air Quality Management District set forth air quality data from its 30 monitoring stations in the study area. As a whole, the air quality in the study area can be harmful in comparison with both federal and state standards in some or all areas. During the period of study, the annual maximum concentrations of ozone, carbon monoxide, and particulate matter in the study area totally exceeded the federal standards by a wide margin.
In 1997, maximum 1-hour average and 8-hour average of ozone concentrations (0.21 ppm and 0.14 ppm) were 168% and 169% of the federal 1-hour and 8-hour standards. After significant long-term improvement in air quality, ozone concentrations in 1998 continued to exceed federal and state standards. The study area recorded its lowest ozone concentration on record in 1999 and was the first year that the area did not record the highest ozone concentration in the nation; nonetheless, Figure 2 shows that the monthly distribution of the number of days for ozone still exceeded the federal standards. According to a survey, “Maximum 1-hour average and 8-hour average ozone concentrations in 1999 (0.17 ppm and 0.143 ppm) were 136% and 168% of the federal 1-hour and 8-hour standards, respectively” (South Coast Air Quality Management District [SCAQMD], 2004). Happily, not only the number of exceedances in 1999 has been widely reduced compared to the past few years, but also the period of the year appearing high ozone concentration has been diminished significantly (SCAQMD, 2004).
Figure 2
Maximum Pollutant Concentrations in 1999 as Percent of Federal Standards
South Coast Air Basin Compared to U.S. Metropolitan Areas
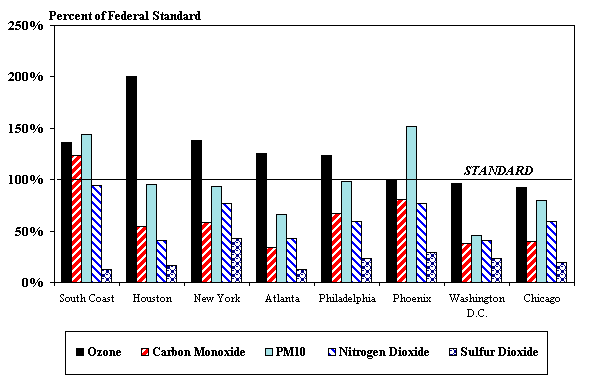
SOURCE: South Coast Air Quality Management District, 2000.
Meteorological Aspects
Here it is important to understand temperature data with regard to meteorological measurements. The temperature data are collected from the statewide integrated pest management program of the University of California via 38 monitoring stations in study area. During the period of study, the mean temperatures in part of Los Angeles and Riverside were higher than the rest of study area. Figure 3 shows that there is a wide range of mean temperature from 52.25F° to 82.56F° in the study area (University of California IPM Online, 2003).
Dependent Variable
The purpose of the analyses performed in this paper is to find out the correlation between environmental parameters and asthma hospital admission rates. Here, the hospital admissions for asthma are considered as the dependent variable. Hospital admission data related to daily asthma patients in zip area, are non-negative integers In addition, this data, based on the ICD-9-CM code, is gathered from medical information reporting proposed by California Office of Statewide Health Planning and Development. ICD-9-CM code started with 493 is defined as an asthma case.
Figure 3
Mean temperature in California’s South Coast Air Basin area during the period of study
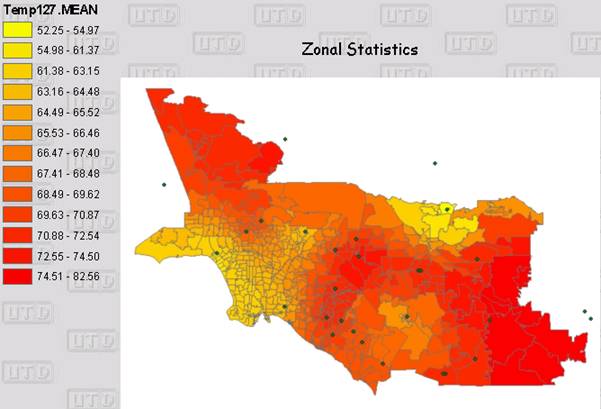
SOURCE: University of California IPM Online, 2003.
Explanatory Variables
Considering that each variable is evaluated alone and in combination with others, the form of the relationship and relative strength of association are examined as well. As a result, the explanatory variables can be categorized into two parts, including environmental and social-effect aspects.
The subgroup of the environmental part subsumes air quality and meteorological variables. Regarding air quality, ozone is representative trigger of causing asthma. The analysis is based on two measures of ozone whereby figuring out the effect on asthma hospital admission rates. One of the measures is today’s ozone level in zip area, and the other is the ozone level of some days before, the latter of which serves as an independent variable to examine how many days lag for ozone to affect asthma. On the other hand, day-to-day temperature acts as a typical variable for asthma with regard to meteorological aspect. The measures used as air quality are today’s temperature and successive temperatures of some days before. The aim is to indicate clearer relationship and reflection between asthma hospital admission rates and daily temperature mean.
The social-effect variables comprise age, race, sex, income, and educational level. According to California Office of Statewide Health Planning and Development, race is simply categorized as white and nonwhite among the hospitals. Income is measured by the median household income and per capita money income, both of which are associated with the patient's zip code. Educational level is divided into two parts that are with high school degree and with Bachelor's degree or higher.
Methodology
This study uses some methodologies that impose a disciplined process on software development with the aim of making software development more efficient. Poisson Model is applied to this paper for analyzing the relationships of daily peak ozone levels, daily temperature mean, and asthma hospital admission rates as a result of the dependent variable with non-negative integer values. Additionally, Xtpoisson Model in the software of Stata is used because of the panel data set, which includes both cross-sectional and time-series information. Based on Xtpoisson fitting a fixed-effects (fe), a random-effects (re), or a population-averaged (pa), the fixed effect model is used to control the spatial difference between the zips and uses the day's lag to control the temporal difference. The following is the Panel Poisson Model:
Zit = βi + β1 X it +β2 Y it +β3 r i + ε
Where Z = Today's asthma in zip area i and time t
X = Today or #days before's ozone level in zip area i and time t
Y = Today or #days before's temperture level in zip area i and time t
r = Measured social variables
βi = Fixed-effects: zip code heterogeneity is time invariant
βk = Temperature, k = 1 to 3
ε= Error
Another methodology is the use of geographic information system (GIS) methodology to refrain from the spatial obstruction and to advance the estimates of ozone exposure to individuals. Through using GIS methodology, it is more precise to calculate a mean count of ozone exposure across the widely study area. Based on a number of closer monitoring stations in the study area, a distance calculation is used to receive the ozone exposure value of the zip code centroid.
Results
Summary of various statistics database demonstrates that ozone causing exacerbation of asthma is reasonably convincing, and it has a positive correlation with asthma; however, the evidence linking ozone to asthma attacks shows the lag in effect. In 1996, Buchdahl et al reported that independent of season, temperature, and wind speed, day to day variations in daily average concentrations of ozone have significant associations with the incidence of acute asthma. In addition, in the reporting of Schoettlin and Landau, the results of a study of a panel of 137 asthmatic subjects in Pasadena, California, show that there are significantly more attacks on days with a maximum 1-hour ozone concentration than on days with lower levels of ozone pollution. Based on these statistics and other data collected from AQMD, it is apparent by Panel Poisson Model that expanding ozone concentration leads to an increase in asthma attack with a probability of approximately 1 to 2 days lag.
On the other hand, the modeling of temperature variable reported by Ritchie and Lehnen shows a statistical significance of a negative relationship between temperature and asthma admissions. An innovative statistical approach proposed by Balmes involving a multiple logistic model for each subject's asthma attack probability is employed, and variables representing previous attack record are included as well. With this approach, it proves that warm temperature is positively associated with asthma attacks. In consideration of the literature review, Panel Poisson Model is applied to examine and bring the result of 2 to 3 days lag for temperature to affect asthma.
Summary and Conclusions
After controlling the time and spatial difference of these variables, this research shows that daily peak ozone levels have a positive relationship with asthma hospital admission rates and that there is 1-2 days lag for ozone to affect asthma, whereas the daily temperature mean has a negative relationship with the asthma hospital admission rates and that there is 2-3 days lag for temperature to affect asthma.
According to the statistical results in this paper, ozone acts as one of the risky factors to increase hospital admissions for asthma. Apparently, the government has the responsibility for taking a strong stand against air pollution and formulating policies in controlling the situation. Government policies to prevent or reduce air pollution affect not only people’s lives but also firms’ production costs. As a result, it is important to establish the framework for evaluating public policies. Cost-benefit analysis is commonly used for “the systematic comparison of all the costs of a program with all of the benefits” (Brux, 2005, p. 68). In reconciling the costs with the benefits of environmental protection to make the policies efficient, a wide and long view must be taken. In addition, the benefits and costs of environmental program calculated in monetary and nonmonetary terms need to be considered as well.
References
American Thoracic Society. (1996). Health Effects of Outdoor Air Pollution. Part 1. Am J Respir Crit Care Med. 153: 3-50.
Balmes J. R. (1993). The Role of Ozone Exposure in the Epidemiology of Asthma. Environ Health Perspect. 101, Suppl. 4: 219-224.
Browne, M. L., Ju, C. L., Recer, G. M., Kallenbach, L. R., Melius, J. M., & Horn, E. G., (2001). A Prospective Study of Health Symptoms and Aspergillus Fumigatus Spore Counts near a Grass and Leaf Composting Facility. Compost Science & Utilization. Vol. 9, Issue 3.
Brux, J. M. (2005). Economic Issues and Policy. 3th ed. pp. 57-58; 62-63; 68. Thomson South-Western.
Buchdahl R., Parker A., Stebbings T., & Babiker A. (1996). Association between air pollution and acute childhood wheezy episodes: prospective observational study. Brit Med J. 312: 661-665.
California Office of Statewide Health Planning and Development. (2005). Medical Information Reporting for California (MIRCal) . Available at: http://www.oshpd.ca.gov /HQAD/PatientLevel/index.htm. Accessed on 21 Mar. 2005. National Institutes of Health. (1998). Global plan launched to cut childhood asthma deaths by 50%. Available at: http://www.nhlbi.nih.gov/new/press/asthma1.htm. Accessed on 17 Feb. 2005.
National Institutes of Health. (No date). What Causes Asthma? Available at: http://www
.nhlbi.nih.gov/health/dci/Diseases/Asthma/Asthma_Causes.html. Accessed on 17 Feb. 2005.
Pediatric Health News Releases. (2003). Study Examines Relationship of Outdoor Air Quality and Asthma; Moderate Ozone Levels Not Implicated in Flareups. Available at:
http://www.cincinnatichildrens.org/about/news/release/2003/2-asthma.htm. Accessed on 22 Mar. 2005.
Ritchie, I. M., & Lehnen, R. G.. (2004). Health Effects of Ozone and Other Environmental Measures Area, 1997-1999. Internet Journal of Pulmonary Medicine, Vol. 4, Issue 1.
Sachs, M. I. (2001). Trends in the Cost of Illness for Asthma in the United States, 1985-1994, Journal of Allergy and Clinical Immunology, Vol. 108, Issue 2.
Schoettlin C. E. & Landau E. (1961). Air pollution and asthmatic attacks in the Los Angeles area. Public Health Reports. 76:545-549.
South Coast Air Quality Management District. (2004). Air Quality Data by Year. Available at: http://www.aqmd.gov/smog/historicaldata.htm. Accessed on 17 Mar. 2005.
Thompson, A. J., Shields, M. D., & Patterson, C. C. (2001). Acute Asthma Exacerbations and Air Pollutants in Children Living in Belfast, Northern Ireland. Archives of Environmental Health. Vol. 56, Issue 3.
Tolbert P. E., Mulholland J. A., MacIntosh D. L., Xu F., Daniels D., Devine O. J., Carlin B. P., Klein M., Dorley J., Butler A. J., Nordenberg D. F., Frumkin H., Ryan P. B., & White M. C. (2000). Air Quality and Pediatric Emergency Room Visits for Asthma in Atlanta, Georgia. Am J Epid 151(8): 798-810. University of California IPM Online. (2003). California Weather Database. Available at: http://www.ipm.ucdavis.edu /WEATHER /wxmap.html. Accessed on 17 Mar. 2005.
U.S. Census Bureau. (2005). Population and Household Economic Topics. Available at: http://www.census.gov/population/www/index.html . Accessed on 20 Mar. 2005. |